

Analyzing size of ELF sections and symbols to generate a modular report.
Source code for this article is at vppillai/MPLABXMemoryAnalyzer.
Introduction
If you are working on any serious embedded systems project, you will come across the need to optimize the memory footprint of your code sooner or later. When the crude methods like high levels of compiler optimization and the standard tips and tricks wont cut it any more, you will have to break out your work boots and the hardhat and get to digging. A map file typically gives you a fair idea of what pieces in your code is taking up the most memory. There are even wonderful tools like amap that gives you a graphical interface to look into the map file output and analyze the memory distribution in your image. However, IDEs tend to have their own ways of dealing with how your code is rearranged to facilitate a build. This means, the names of source files that you see in the map file will be modified and will not be indicative of your original source code structure. MPLABX is particularly notorious for doing this.
When you compile an MPLABX project, it creates an _ext folder with
a bunch of compilation unit numbers based on how the IDE sees your code.
In large projects, you will be importing a lot of pre-written code from
SDKs and libraries that you want to group together for your initial
memory analysis. The IDE re-grouping code renders the tools like
amap unusable to perform modular analysis of the memory footprint of
your code.
The implementation we are discussing in this article gives an output like:
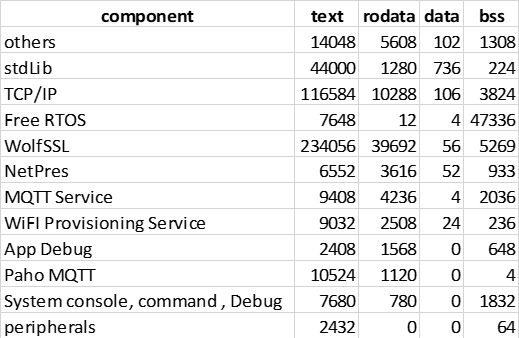
Summary of memory usage
Source code and instructions are available in Github.
Problem Statement
I had to write a tool to address this very specific issue while working on a PIC32 based project. I had a bunch of third-party tools and Harmony3 code that were being included in my project along with my application code. I wanted to get a report of the modular distribution of static memory. I wanted:
-
Reporting of memory elements as given by the gnu
sizecommand. -
Grouping of known modules like TCP/IP , Peripherals etc. to give an overview for further analysis.
-
Reporting of symbol-file-size mapping in such a way that I can trace back the file corresponding to the symbols.
Existing tools
There are a bunch of existing tools that could satisfy parts of my requirement. These were the tools that I eventually used to piece together my own implementation.
amap
First in the group is amap. It is a cross-platform Map File Browser that gives a visual interface to navigate and filter map file entries. It is a wonderful tool for manual analysis. However, the issues I faced were:
-
The map file generated by xc32 includes a bunch of non-linked sections like
.gnu.attributesor.comment. These are not included in the final image but there is no straight forward way to filter these out from the report in one-shot. -
Because of the
_extfolder based mechanism that MPLABX has, the modules reported byamapis limited to components included from a pre-compiled library.
MapViewer
From its Github page, MapViewer is a Windows (C#/.NET)application that displays information extracted from the MAP file (generated by the GNU linker LD) and from the ELF executable image.
This tool has a mechanism to filter out the un-used sections and reads
the elf file to generate a more accurate report. It also uses the
platform specific tools like xc32-readelf and xc32-nm to read
the elf. So, the report generated is more accurate. However,
-
The tools got hit by MPLABX’s bloody
_extbuild folder. So, there is no way to map the symbols to the actual source files. -
It takes an awful lot of time to generate the report. It took around 6 minutes in my case with a fairly large image.
Dwex
A cross-platform GUI utility for visualizing the DWARF debugging information in executable files, built on top of pyelftools and filebytes. Runs on Windows, MacOS X, and Linux. Supports parsing the following file types for DWARF data:
While not a tool for parsing map files or to generate size information, dwex gave me a lot of insight into the DWARF assortment in object files. I had a decent understanding of DWARF. But dwex solidified the understanding greatly and gave me a breakthrough in my implementation. I will explain this in a later section.
This tool is a goldmine for anyone who wants to explore elf, DWARF or
even pyelftools.
gcc tools
gcc comes with all the tools required to analyze and manipulate all aspects of code and image. However, there is a learning curve.
Implementation Details
Source code and releases can be found in Github. There is a single file names mapfileParse.py. The following explanations are based on the code in this file.
-
A lot of the heavy lifting is done using
amapandxc32-readelf. This is to avoid reinventing the wheel. -
Do basic sanity checks and cleanup using setPaths() and
checkTools().a.
setPaths()makes sure that irrespective of where the tool is executed from, absolute paths are used. For some reason, relative paths were very slow to execute withxc32-readelfb.
checkTools()simply usesxc32-sizeto see of the required PATHs are set. -
Intermediate and stale files are deleted in
cleanupOutput() -
cleanupMapFile()cleans the map file by removing all unlinked sections. I am using plain old regex for this. This creates a new map file that can be used directly withamap. The code as well passes this toamapand generates parsed csv compatible output. -
parseMap()takesamapoutput and maps existing modules that has been identified byamap. This is typically just available for symbols coming from pre-compiled libs. -
attachFileNames()then usesxc32-addr2lineto find actual source file names of symbols that has not been assigned a module name byamap. However, some of the source files cannot be identified byaddr2line. This is typically for.Sfiles . But I have seen this happening for other files as well. I did not really go digging to find the reason for this.addr2elfcan accept multiple addresses and provide the corresponding file names and line numbers in one shot. We pass 2000 addresses in one shot . This minimizes the number of timesxc32-addr2elfneeds to be invoked. These calls are very expensive in terms of execution time.
-
finalizeFileNames()does something interesting to fill in the gaps whereaddr2linefailed to map a file name.amapgives the compiled object file name inside the_extfolder. We usexc32-readelfto dump out the DIE0 of the DWARF info in this object file. This includes theDW_AT_nameentry that points to the actual source file that was used to generate the object file inside_ext.- Once we identify the source file of an object, we store this in an internal dictionary to re-use it for all other symbols inside that object file. This saves a ton of time since calling the gcc elf tools are very expensive in terms of execution time.
-
filewiseSize()adds up all the sizes corresponding to a file name. This gives us an aggregate of the components reported byxc32-sizeon the whole elf - but now split file wise.- This includes .text, .rodata, .data & .bss.
-
summarizeComponents()maps components into modules based on a set of paths:module relationship defined incompDefinition.


Leave a comment